


XRP Faces Rejection at $2.67 Amid Deeper Pullback Risks as Bitcoin Slides After Fed Cuts
XRP has encountered significant resistance at the $2.67-$2.69 range, marking this area as critical for traders. Support levels are identified around $2.580 and the 200-day Exponential Moving Average (EMA) at approximately $2.61, providing potential anchors for price movement.
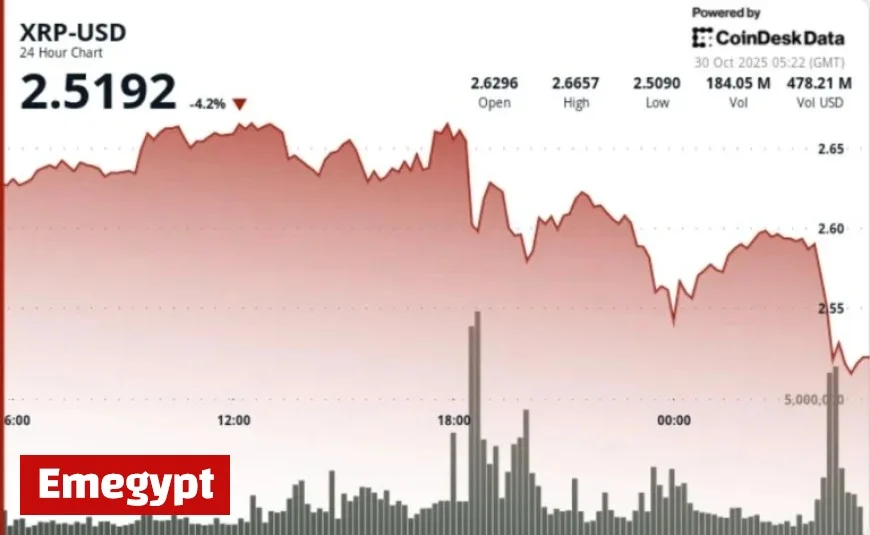
XRP Price Movement and Trading Volume
Recently, XRP’s price fell from about $2.63 to $2.59. This decline followed an unsuccessful attempt to break through the $2.67 resistance. During this period, trading volume surged to around 392.6 million tokens, which is approximately 658% above its recent average.
This price action coincided with rising open interest in XRP futures, approaching early-2025 highs of nearly $2.9 billion. On-chain data further indicates a trend of major wallets unloading substantial quantities of XRP, leading to concerns over profit-taking despite ongoing institutional interest.
Price Action Summary
- XRP traded between $2.63 and $2.59 over a 24-hour period.
- The price faced a decisive barrier at the $2.67 resistance level, where trading volume increased significantly.
- A notable drop occurred around 04:04-04:05 UTC, where the price fell from $2.590 to $2.579.
- This decline was on a volume of about 2.18 million tokens, roughly 355% above the average for that hour.
- Trading temporarily halted between 04:08-04:10 UTC due to a brief period of near-zero volume.
Technical Analysis of XRP
The rejection at around $2.67 confirms a short-term bearish outlook. Although the long-term trend suggests a slight accumulation, the immediate risk now leans towards the downside. Elevated futures open interest indicates market activity, yet recent data shows that major wallet sell-offs dominate the current landscape.
Momentum indicators like the Relative Strength Index (RSI) and the Moving Average Convergence Divergence (MACD) reflect a divergence between price highs and momentum indicators. This warning suggests the possibility of a price correction.
What Traders Should Consider
Traders should view the current price levels as a high-risk, high-reward pivot zone. A rebound from the $2.58-$2.60 range with increased volume could help restore momentum, potentially targeting prices between $2.70 and $3.00. Conversely, a break below the $2.58 support level may lead to further declines towards $2.53 and potentially down to $2.50, especially if robust outflows from whale wallets continue alongside dropping open interest.
To navigate these conditions effectively, traders should closely monitor wallet flow trends, futures open interest dynamics, and any significant volume spikes. This vigilance will help determine whether the current price behavior is merely consolidation or heralding a deeper correction.